【译文】使用 Prometheus 和 Thanos 监控 Kubernetes 工作负载
介绍
恭喜!您已经成功说服您的项目经理、研发副总裁或者 CTO 使用 Kubernetes 上的容器将公司的工作负载歉意到微服务。
您非常高兴,一切都按计划进行,您创建了第一个 Kubernetes 集群(3 个主要的云服务商,Azure、AWS 和 GCP 都有一种简单的方法来配置托管或非托管 Kubernetes 平台),开发您的第一个容器化应用程序,并将其部署到集群中。那很容易,不是吗?
一段时间后,您意识到事情变的更加复杂,您有多个应用程序要部署到集群,因此需要一个 Ingress Controller,然后,在部署到生产环境之前,您需要了解工作负载的执行情况,所以开始需要监控解决方案,幸运的时,您找到了 Prometheus,部署它,添加 Grafana,就完成了!
后来,您开始疑惑 —— 为什么 Prometheus 仅使用一个副本运行?如果容器重新启动会怎样?或者只是版本更新?Prometheus 可以存储我的指标多长时间?当集群出现故障时会发生什么?我是否需要用于 HA 和 DR 的另一个集群?我将如何对 Prometheus 进行集中查看?
好吧,继续阅读,聪明的人已经知道了。
典型的 Kubernetes 集群
下图是 Kubernetes 上的典型监控部署架构:
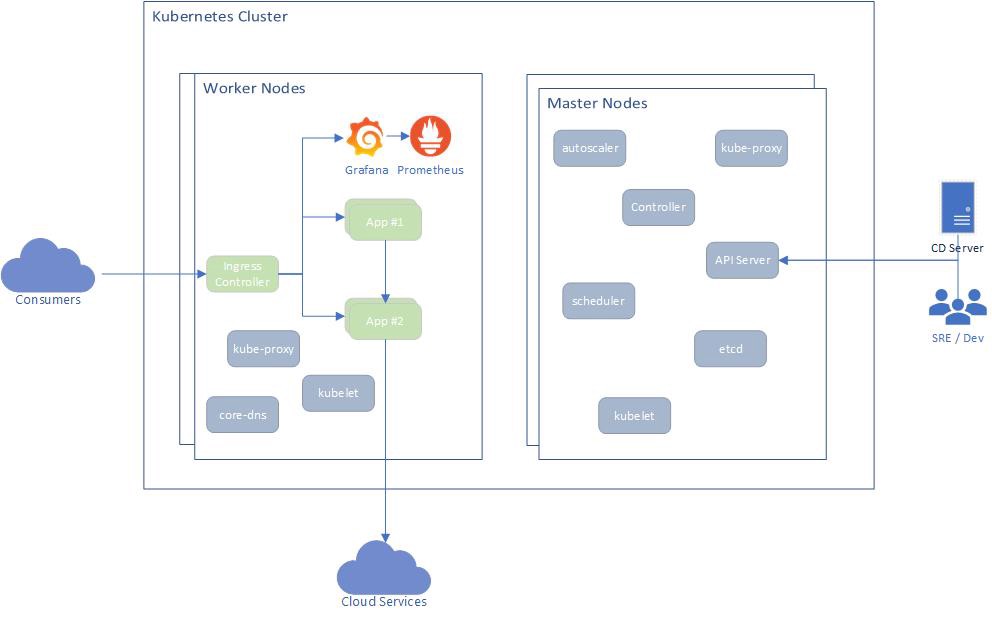
典型的 Kubernetes 集群
部署架构包括 3 层:
- 底层虚拟机 —— 主节点和工作节点
- Kubernetes 基础架构应用
- 用户应用
不同的组件在内部相互通信,通常使用 HTTP(s)(REST 或 gRPC),其中一些将 API 暴露给集群外部(Ingress),这些 API 主要用于:
- 通过 Kubernetes API 服务器进行集群管理
- 通过 Ingress Controller 暴露的用于应用程序交互
在某些情况下,应用程序可能会将流量发送到集群(Egress)之外以使用其他服务,例如 Azure SQL、Azure Blob 或任何第三方服务。
要监视什么?
监控 Kubernetes 应该考虑到上述所有三个层。
底层虚拟机:为确保底层虚拟机运行正常,应收集以下指标:
- 节点数
- 每个节点的资源利用率(CPU、内存、磁盘、网络带宽)
- 节点状态(就绪、未就绪等)
- 每个节点上运行的 Pod 数
Kubernetes 基础设施:为确保 Kubernetes 基础设施运行正常,应收集以下指标:
- Pod 健康状态 —— 就绪、状态、重启次数、运行时长
- Deployment 状态 —— 期望、当前、最新、可用、运行时长
- StatefulSet 状态
- CronJobs 执行状态
- Pod 资源利用率(CPU 和内存)
- 健康检查
- Kubernetes 事件
- API Server 请求状态
- Ectd 状态
- 挂载卷状态
用户应用程序:每个应用程序都应基于其核心功能公开自己的指标,但是,大多数应用程序都有一些通用的度量标准,例如:
- HTTP 请求(总数、延迟、响应代码等)
- 外部连接数(例如数据库连接)
- 线程数
收集上述指标后,您将可用构建有意义的告警和仪表盘,下面将对此进行简要介绍。
Thanos
Thanos 是一个开源项目,由一组组件构建而成,开源将这些组件组合层具有无限存储容量的高可用的度量系统,并可以将其无缝添加到现有 Prometheus 部署之上。
Thanos 利用 Prometheus 存储格式在任何对象存储中经济高效地存储历史指标数据,同时保持快速查询延迟。此外,它在所有 Prometheus 安装中提供了全局查询视图。
Thanos 的主要组件有:
- Sidecar:连接到 Prometheus 并将其暴露以通过 Query GateWay 进行实时查询和(或)将其数据上传到云存储以供长时间使用。
- Query Gateway:实现 Prometheus 的 API,以聚合来自底层组件(例如 Sidecar 或 Store Gateway)的数据
- Store Gateway:暴露云存储的内容
- Compactor:压缩和下采样存储在云存储中的数据
- Receiver:从 Prometheus 的远程写入 WAL 接收数据,将其公开和(或)上传到云存储
- Ruler:根据 Thano 中的数据评估记录和告警规则以进行展示和(或)上传
在本文中,我们将重点介绍前三个组件:
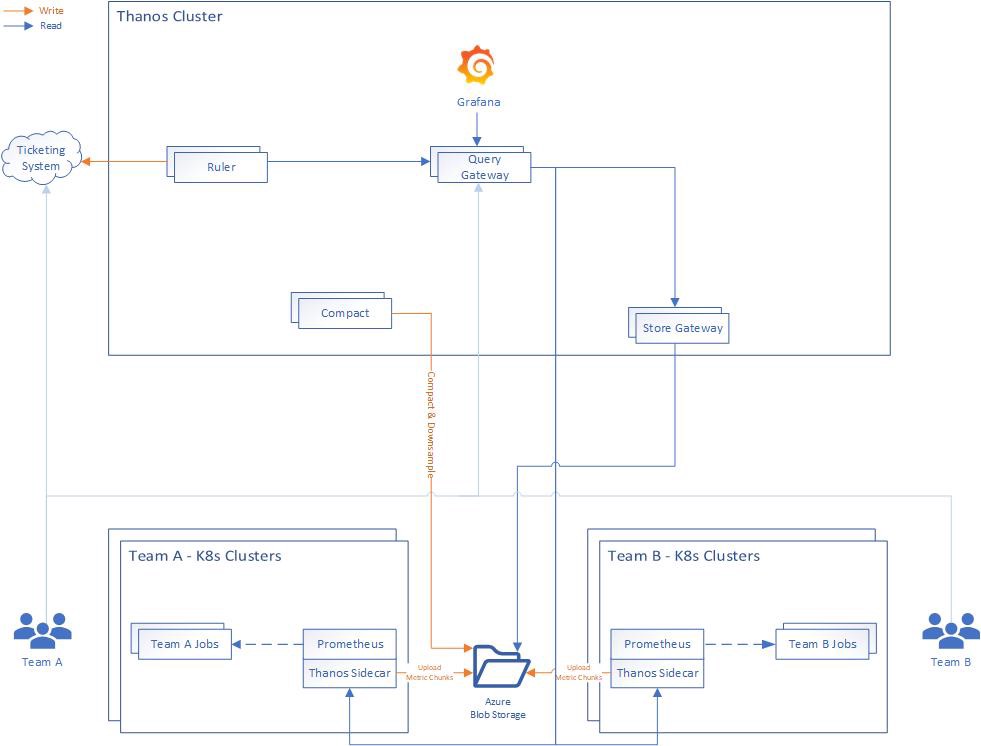
Thanos 部署架构图
部署 Thanos
我们首先将 Thanos Sidercar 部署到我们的 Kubernetes 集群中,这些集群用于运行工作负载以及 Prometheus 和 Grafana。
尽管有很多方法可以安装 Prometheus,但我更喜欢使用 Prometheus-Operator,它使您可以轻松地监控 Kubernetes 服务的定义以及 Kubernetes 实例的部署和管理。
安装 Prometheus-Operator 的最简单方法是使用其 Helm chart,该 chart 内置了对高可用性的支持,Thanos Sidercar 注入和许多预配置的告警,用于监控集群虚拟机、Kubernetes 基础设施和您的应用程序。
在部署 Thanos Sidecar 之前,我们需要有一个 Kubernetes Secret,其中包含有关如何连接到云存储的详细信息,对于此演示,我将使用 Microsoft Azure。
创建一个 blob 存储账户:
az storage account create --name <storage_name> --resource-group <resource_group> --location <location> --sku Standard_LRS --encryption blob
然后,为指标创建一个文件夹(即容器):
az storage container create --account-name <storage_name> --name thanos
获取存储密钥:
az storage account keys list -g <resource_group> -n <storage_name>
创建用于存储设置的文件(thanos-storage-config.yaml):
type: AZURE
config:
  storage_account: "<storage_name>"
  storage_account_key: "<key>"
  container: "thanos"
创建 Kubernetes Secret:
kubectl -n monitoring create secret generic thanos-objstore-config --from-file=thanos.yaml=thanos-storage-config.yaml
创建一个 values 文件(prometheus-operator-values.yaml)以覆盖默认的 Prometheus-Operator 设置:
prometheus:
  prometheusSpec:
    replicas: 2      # work in High-Availability mode
    retention: 12h   # we only need a few hours of retenion, since the rest is uploaded to blob
    image:
      tag: v2.8.0    # use a specific version of Prometheus
    externalLabels:  # a cool way to add default labels to all metrics
      geo: us
      region: eastus
    serviceMonitorNamespaceSelector:  # allows the operator to find target config from multiple namespaces
      any: true
    thanos:         # add Thanos Sidecar
      tag: v0.3.1   # a specific version of Thanos
      objectStorageConfig: # blob storage configuration to upload metrics
        key: thanos.yaml
        name: thanos-objstore-config
grafana:           # (optional) we don't need Grafana in all clusters
  enabled: false
然后部署:
helm install --namespace monitoring --name prometheus-operator stable/prometheus-operator -f prometheus-operator-values.yaml
现在,您应该在集群中运行了一个高可用的 Prometheus,以及 Thanos Sidecar,它可以将您的指标无限期地上传到 Azure Blob 存储。
为了允许 Thanos Store Gateway 访问那些 Thanos Sidecar,我们需要通过一个 Ingress 暴露它们,我正在使用 Nginx Ingress Controller,但是您可以使用任何其他支持 gRPC 的 Ingress Controller(Envoy可能是最好的选择)。
为了确保 Thanos Store Gateway 和 Thanos Sidecar 之间的安全通信,我们将使用双向 TLS,这意味着客户端将对服务器进行身份验证,反之亦然。
假设您拥有 .pfx 后缀的文件,则可以使用 openssl 提取其私钥、公钥和 CA:
# public key
openssl pkcs12 -in cert.pfx -nocerts -nodes | sed -ne '/-BEGIN PRIVATE KEY-/,/-END PRIVATE KEY-/p' > cert.key
# private key
openssl pkcs12 -in cert.pfx -clcerts -nokeys | sed -ne '/-BEGIN CERTIFICATE-/,/-END CERTIFICATE-/p' > cert.cer
# certificate authority (CA)
openssl pkcs12 -in cert.pfx -cacerts -nokeys -chain | sed -ne '/-BEGIN CERTIFICATE-/,/-END CERTIFICATE-/p' > cacerts.cer
以此创建两个 Kubernetes Secret:
# a secret to be used for TLS termination
kubectl create secret tls -n monitoring thanos-ingress-secret --key ./cert.key --cert ./cert.cer
# a secret to be used for client authenticating using the same CA
kubectl create secret generic -n monitoring thanos-ca-secret --from-file=ca.crt=./cacerts.cer
确保您有一个解析为您的 Kubernetes 集群的域,并创建两个子域以用于路由到每个 Thaos SideCar:
thanos-0.your.domain
thanos-1.your.domain
现在,我们可以创建 Ingress 规则(替换 host 值):
apiVersion: v1
kind: Service
metadata:
  labels:
    app: prometheus
  name: thanos-sidecar-0
spec:
  ports:
    - port: 10901
      protocol: TCP
      targetPort: grpc
      name: grpc
  selector:
    statefulset.kubernetes.io/pod-name: prometheus-prometheus-operator-prometheus-0
  type: ClusterIP
---
apiVersion: v1
kind: Service
metadata:
  labels:
    app: prometheus
  name: thanos-sidecar-1
spec:
  ports:
    - port: 10901
      protocol: TCP
      targetPort: grpc
      name: grpc
  selector:
    statefulset.kubernetes.io/pod-name: prometheus-prometheus-operator-prometheus-1
  type: ClusterIP
---
apiVersion: extensions/v1beta1
kind: Ingress
metadata:
  annotations:
    nginx.ingress.kubernetes.io/ssl-redirect: "true"
    nginx.ingress.kubernetes.io/backend-protocol: "GRPC"
    nginx.ingress.kubernetes.io/auth-tls-verify-client: "on"
    nginx.ingress.kubernetes.io/auth-tls-secret: "monitoring/thanos-ca-secret"
  labels:
    app: prometheus
  name: thanos-sidecar-0
spec:
  rules:
  - host: thanos-0.your.domain
    http:
      paths:
      - backend:
          serviceName: thanos-sidecar-0
          servicePort: grpc
  tls:
  - hosts:
    - thanos-0.your.domain
    secretName: thanos-ingress-secret
---
apiVersion: extensions/v1beta1
kind: Ingress
metadata:
  annotations:
    nginx.ingress.kubernetes.io/ssl-redirect: "true"
    nginx.ingress.kubernetes.io/backend-protocol: "GRPC"
    nginx.ingress.kubernetes.io/auth-tls-verify-client: "on"
    nginx.ingress.kubernetes.io/auth-tls-secret: "monitoring/thanos-ca-secret"
  labels:
    app: prometheus
  name: thanos-sidecar-1
spec:
  rules:
  - host: thanos-1.your.domain
    http:
      paths:
      - backend:
          serviceName: thanos-sidecar-1
          servicePort: grpc
  tls:
  - hosts:
    - thanos-1.your.domain
    secretName: thanos-ingress-secret
现在,我们有了从集群外部访问 Thanos Sidecar 的安全方法!
Thanos 集群
在上方的 Thanos 图中,您可以看到我选择将 Thanos 部署在单独的集群中,那是因为我想要一个专用集群,可以在需要时轻松地重新创建它,并使工程师可以访问它,而无需他们访问实际的生产集群。
为了部署 Thanos 组件,我选择使用此 Helm chart。
创建一个 thanos-values.yaml 文件以覆盖默认 chart 设置。
由于 Thanos Store Gateway 需要访问 Blob 存储的权限,因此我们也在该集群中重新创建了存储 secret:
kubectl -n thanos create secret generic thanos-objstore-config --from-file=thanos.yaml=thanos-storage-config.yaml
要部署此 chart,我们将使用与之前创建的证书相同的证书,并将其作为值注入:
helm install --name thanos --namespace thanos ./thanos -f thanos-values.yaml --set-file query.tlsClient.cert=cert.cer --set-file query.tlsClient.key=cert.key --set-file query.tlsClient.ca=cacerts.cer --set-file store.tlsServer.cert=cert.cer --set-file store.tlsServer.key=cert.key --set-file store.tlsServer.ca=cacerts.cer
这将同事安装 Thanos Query Gateway 和 Thanos Storage Gateway,并将它们配置为使用安全通道。
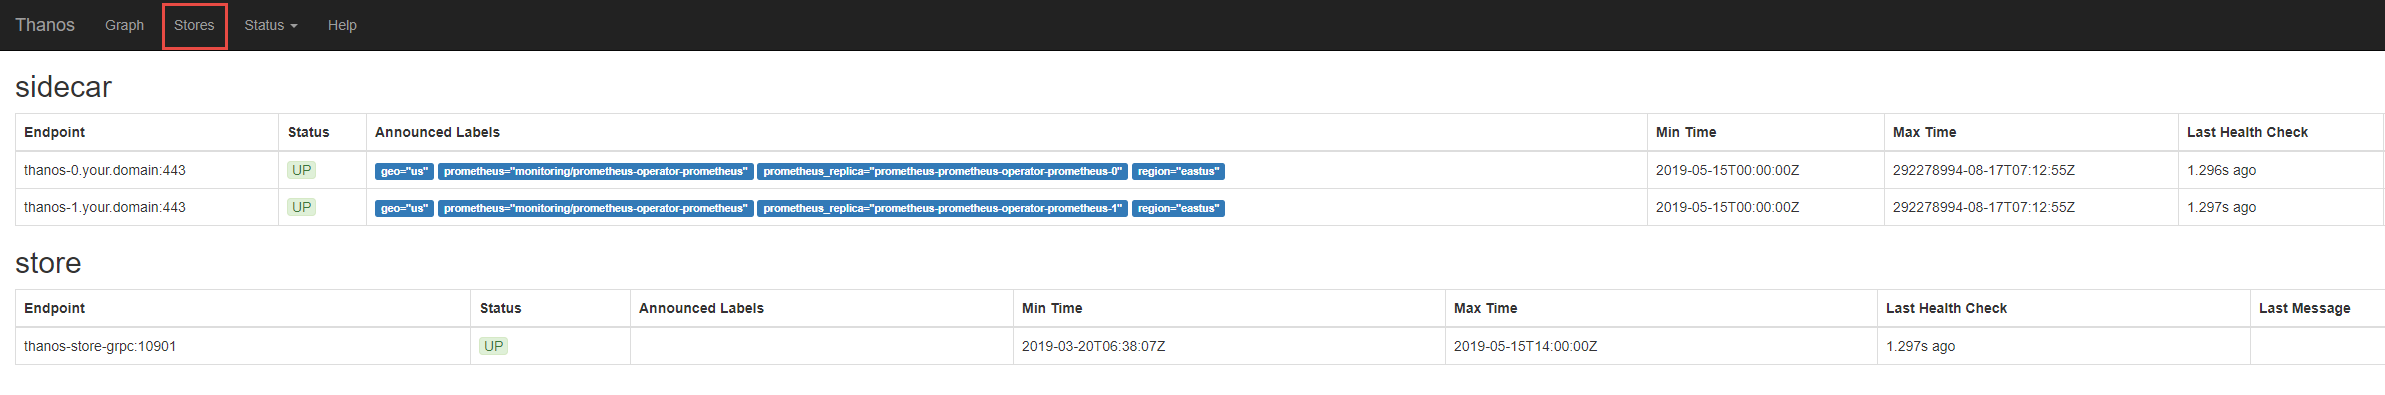
验证
为了验证一切正常,您可以使用以下命令将 Thanos Query Gateway HTTP 服务端口映射出来:
kubectl -n thanos port-forward svc/thanos-query-http 8080:10902
然后打开浏览器访问 http://localhost:8080,您应该会看到 Thanos UI 界面!
Grafana
要添加仪表盘,您只需使用 Helm chart 安装 Grafana。
创建具有以下内容的 grafana-values.yaml:
datasources:
 datasources.yaml:
   apiVersion: 1
   datasources:
   - name: Prometheus
     type: prometheus
     url: http://thanos-query-http:10902
     access: proxy
     isDefault: true
dashboardProviders:
 dashboardproviders.yaml:
   apiVersion: 1
   providers:
   - name: 'default'
     orgId: 1
     folder: ''
     type: file
     disableDeletion: false
     editable: true
     options:
       path: /var/lib/grafana/dashboards/default
dashboards:
  default:
    cluster-stats:
      # Ref: https://grafana.com/dashboards/1621
      gnetId: 1621
      revision: 1
      datasource: Prometheus
    prometheus-stats:
      # Ref: https://grafana.com/dashboards/2
      gnetId: 2
      revision: 2
      datasource: Prometheus
    node-exporter:
      # Ref: https://grafana.com/dashboards/1860
      gnetId: 1860
      revision: 13
      datasource: Prometheus
请注意,我向其中添加了 3 个默认仪表盘,您也可以添加自己的仪表盘(最简单的方法是使用 ConfigMap)。
然后部署:
helm install --name grafana --namespace thanos stable/grafana -f grafana-values.yaml
再次执行端口转发操作:
kubectl -n thanos port-forward svc/grafana 8080:80
非常好!您已经完成了基于 Prometheus 的高可用监控解决方案的部署,改解决方案具有长期存储功能,并且可以跨多个集群进行集中查看!